Summary - Term 1
Project Summary
At the beginning of this term, we have started with the project on UCL-GOSH Data Interchange for Sensors Classifications.
This project aims to visualise streaming Infusion Pump data on a customisable, user-friendly dashboard. At the moment, there is no monitoring system in GOSH which would help clinicians to get insights into patients’ treatment and see if they are hitting the target amount of feed they are prescribing. With this project, the infusion pump dashboard would help clinicians monitor their patients’ treatment. These precious data can be useful for tracking the condition and altering the treatment plan of the patient. Being able to review all the collection of data also helps in carrying out researches by the clinicians.
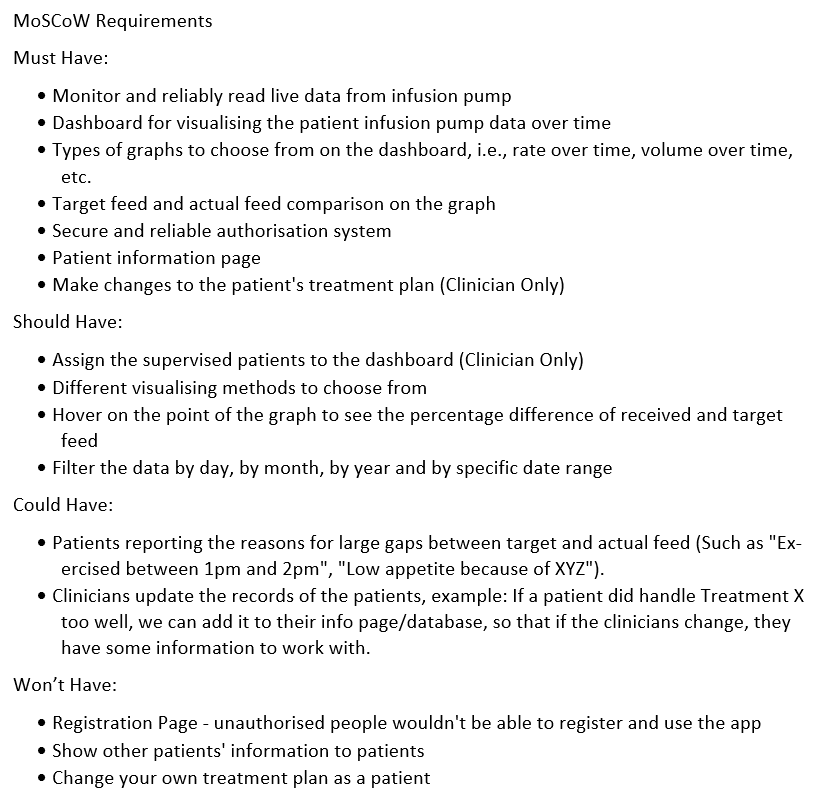
MoSCoW Requirements
After a thorough discussion with our clients, we have finalized our MoSCoW requirements which are key to our development. This means we can be more certain about what aspects should be included or to be avoided when developing the app.
Human-Computer Interaction
Human-Computer Interaction (HCI) is a big focus on the design and implementation of the app to the user. This enables us to develop more ideas on the prototype and also analysing the need of our clients.
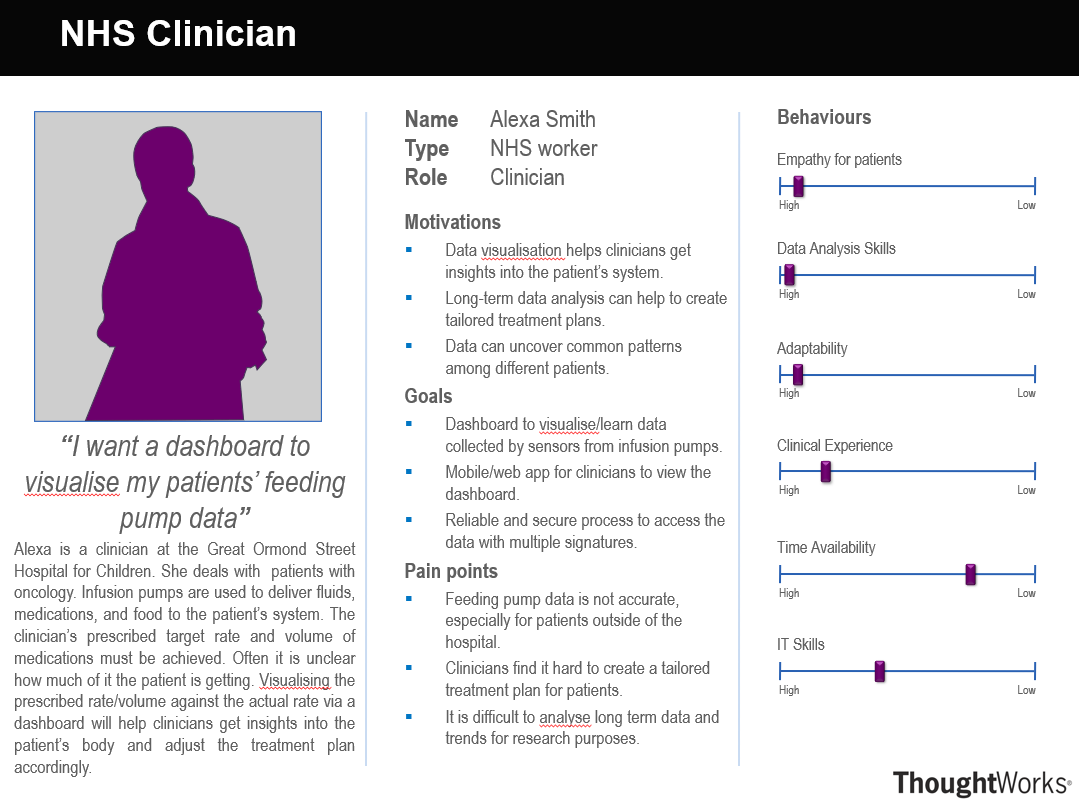
Persona
We created a persona based on discussion with our clients. Demonstrating the background and the basic needs of a user of the app, which helps with finding the requirements of our user.
Sketch
We also hand drafted a sketch of our UI design, so we can put down our ideas and further develop them.
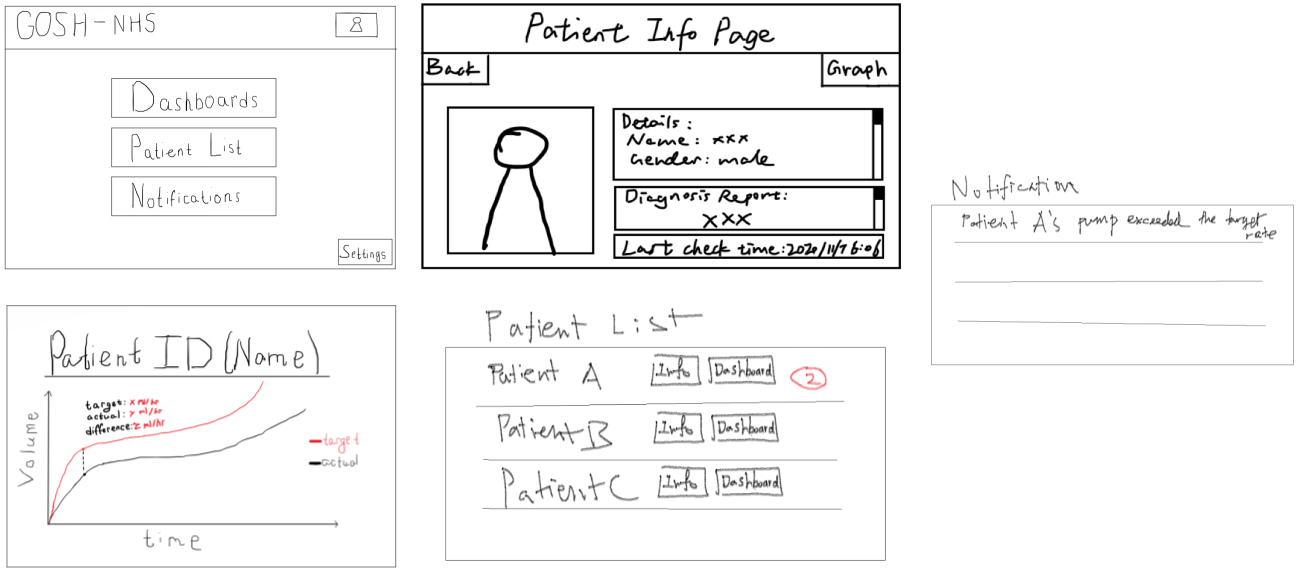
We then reflect on our first draft and made a more developed one which can then be referred to when we create a more polished prototype UI.
Research
To get more familiarise with the overall project, we did some research on the background information, so that we know what devices we are dealing with and what to expect from the user.
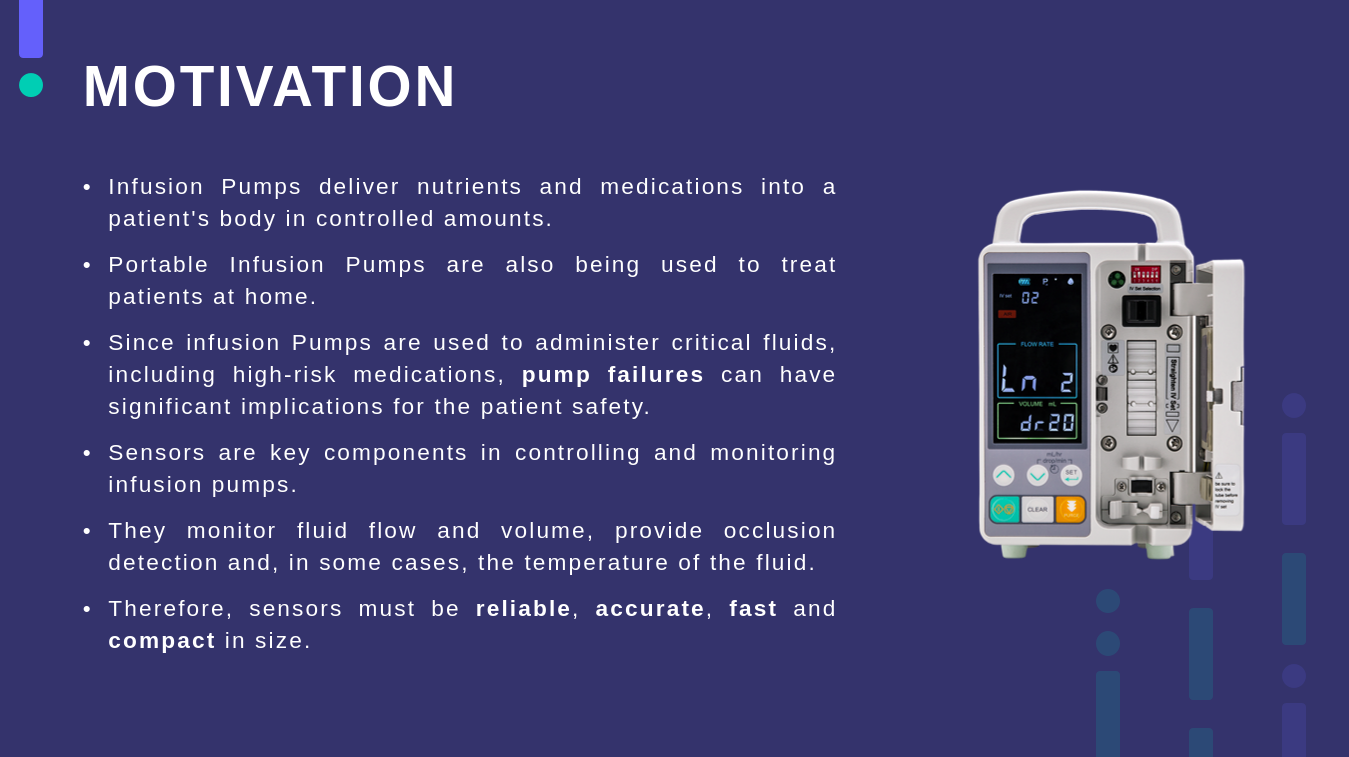
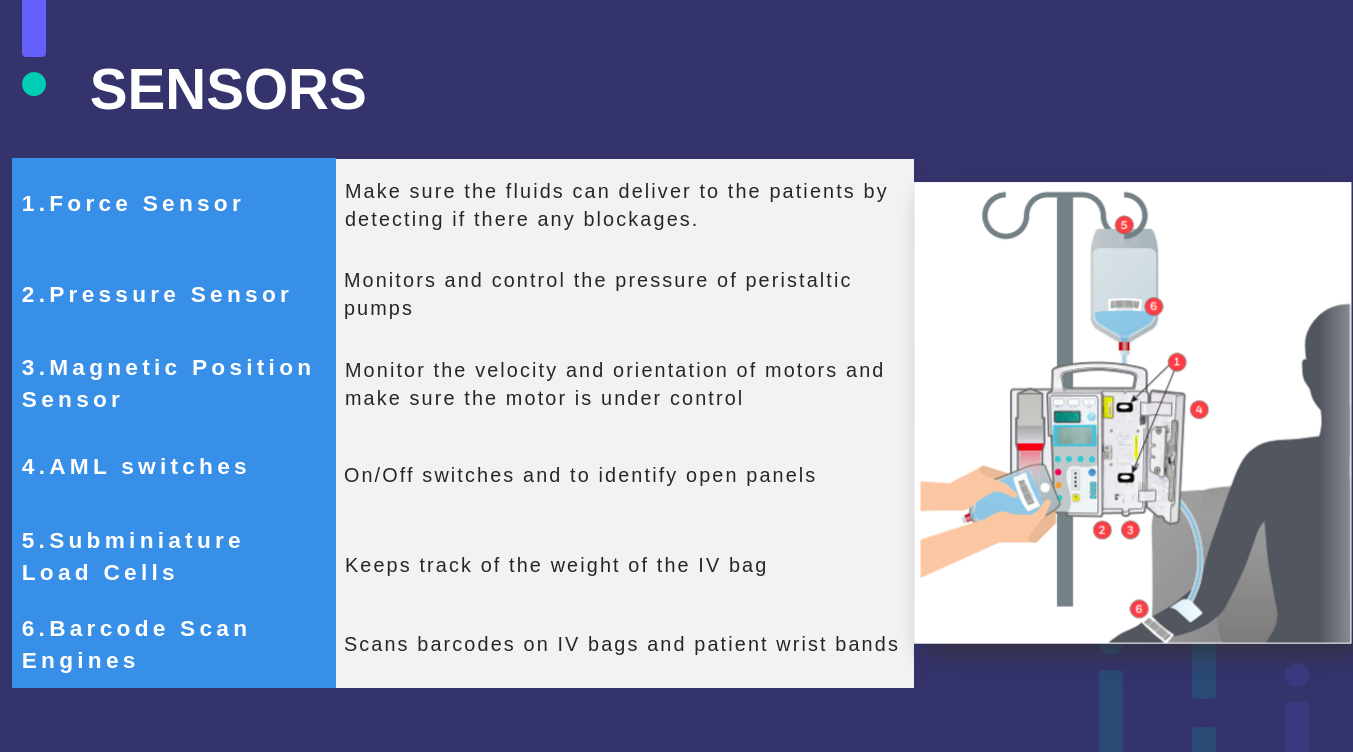
Sensors
This is the primary research on the infusion pump, mainly about the breakdown of different parts of the pumps and their functionality. Knowing about the operation process of the pump is also crucial for giving us an idea of the data that is measured with the pump.
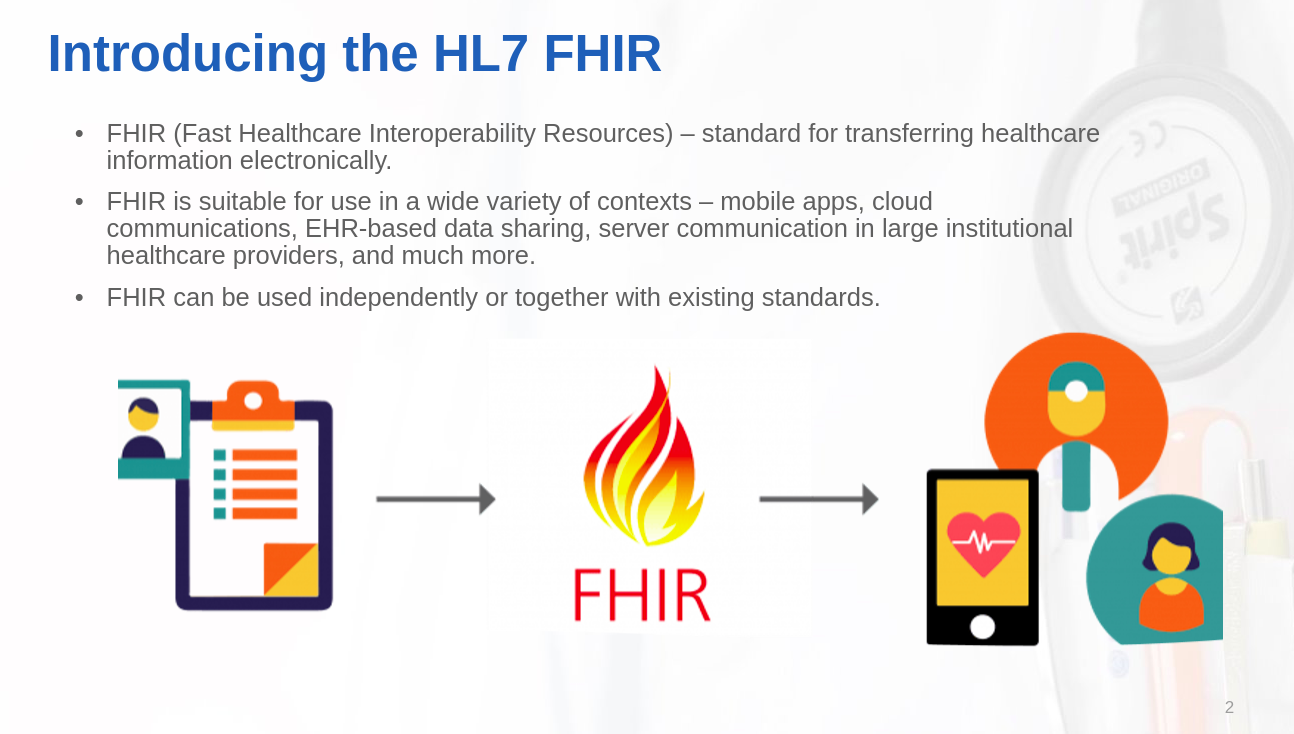
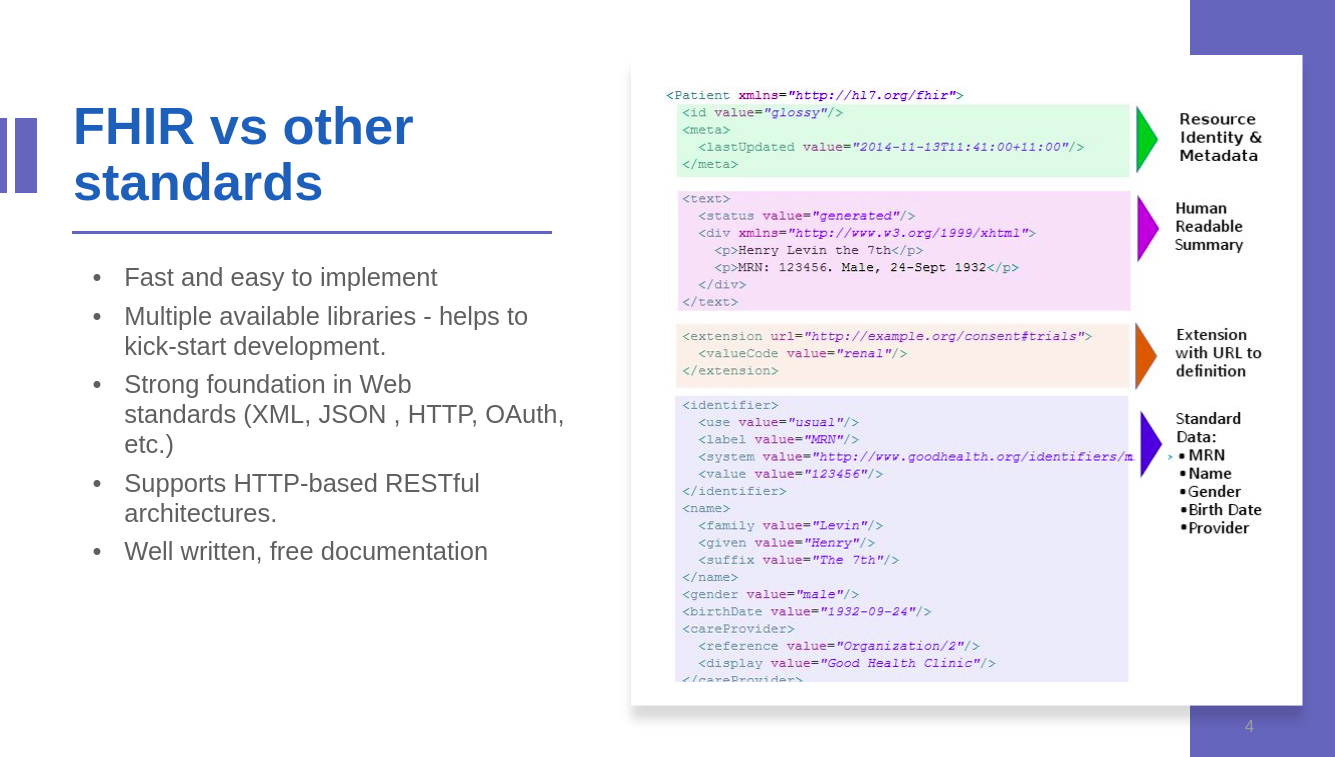
Industrial – FHIR
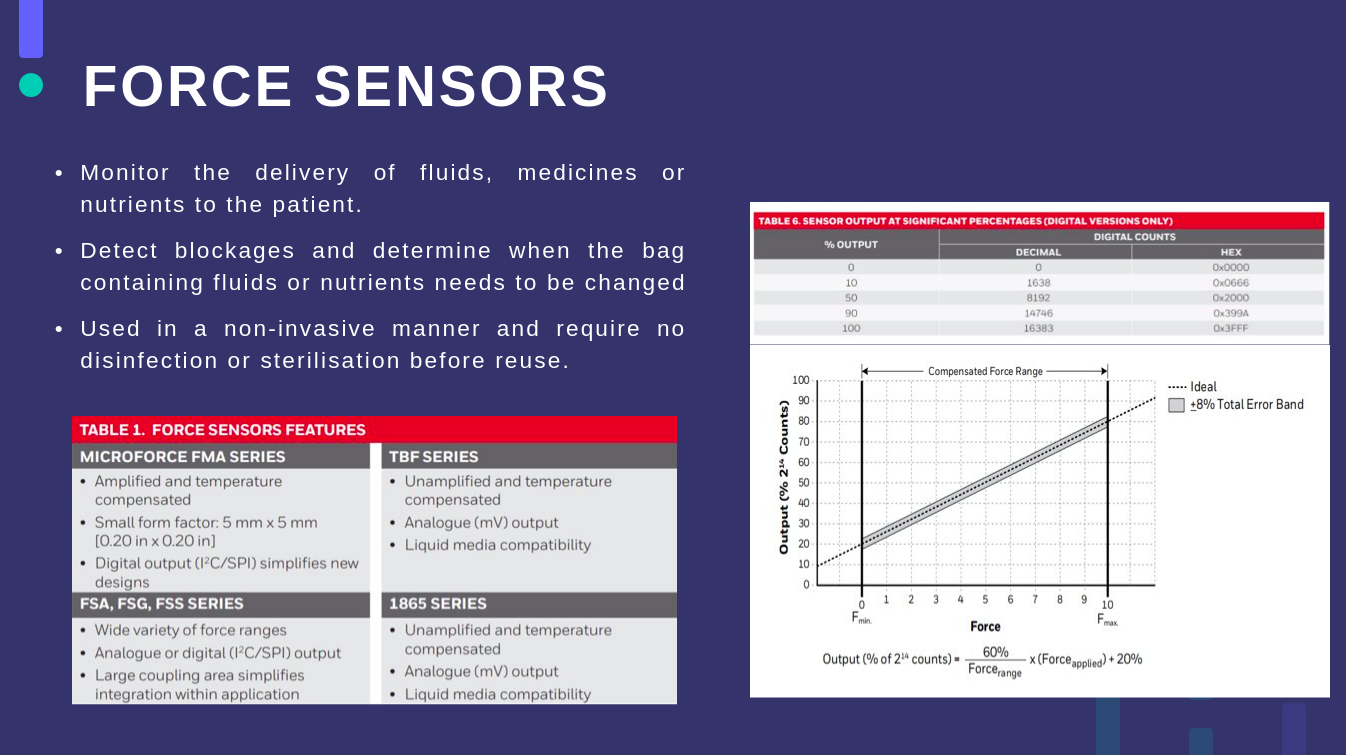
This research is more about the FHIR standards and a more focused look into the force and pressure sensors.
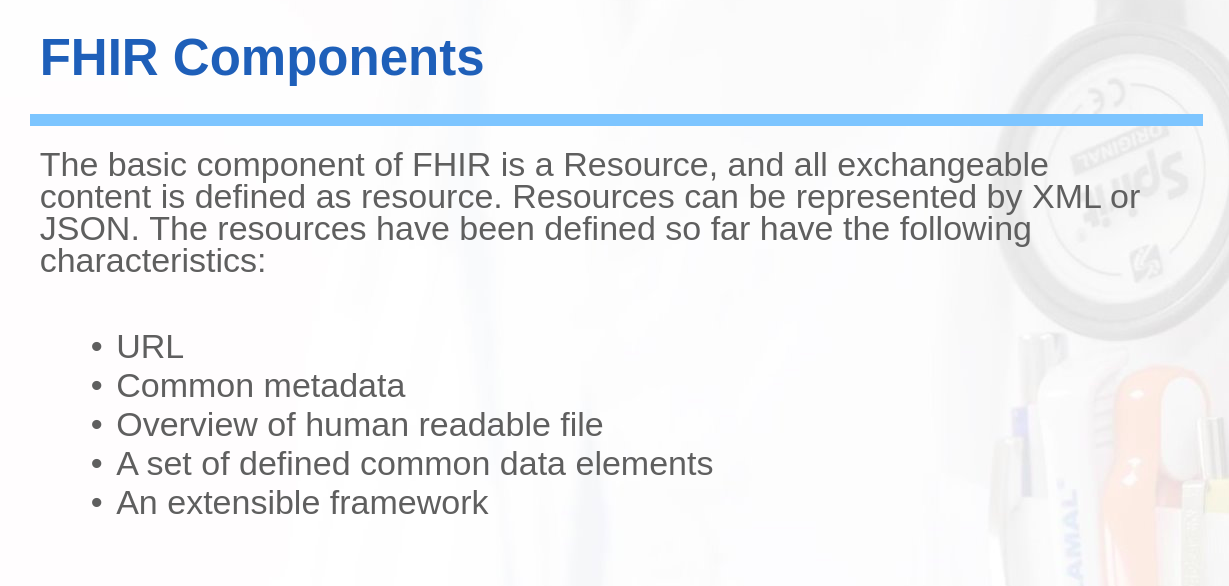
FHIR is a standard that is being used wisely in the healthcare industry. It sets the rules on how medical data is stored and protected. Since we are going to store a great amount of patient information, the FHIR is what we should look at to provide security and reliability.
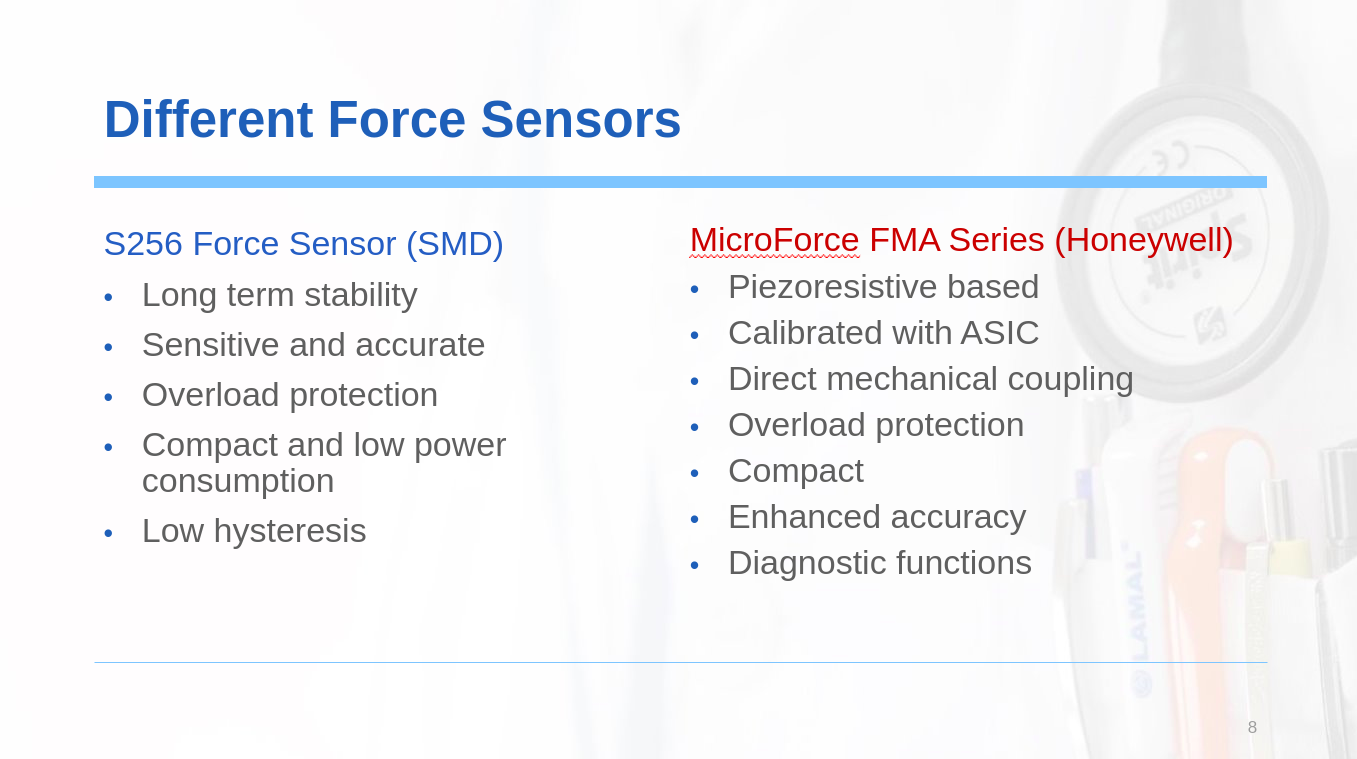
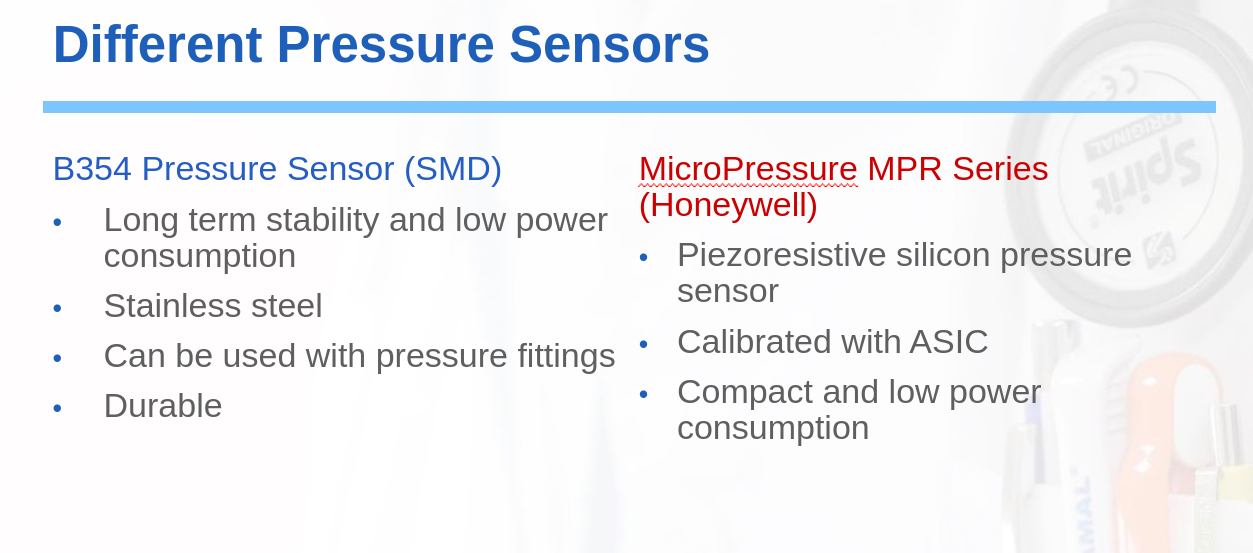
The other part about the force and pressure sensors. We compared the sensors provided by different manufacturers. This enhances our knowledge of the sensors, thus learning what is the key data should be stored for our project.
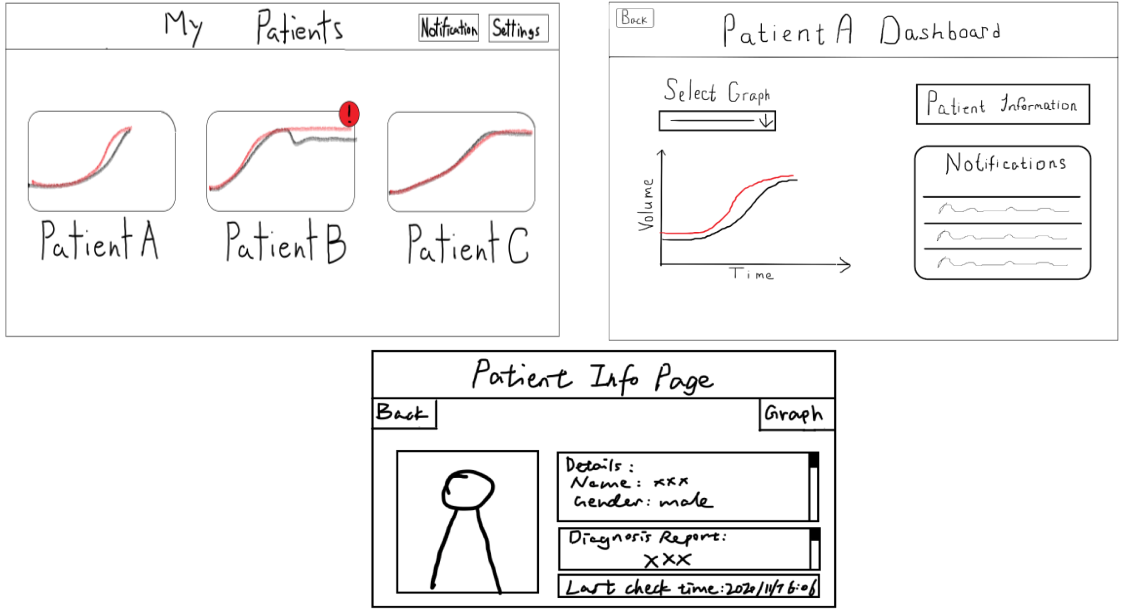
Prototype UI
Having finalized the MosCoW requirements and more background knowledge of this project. We designed a prototype of the UI, demonstrating the basic functionality would look like and how the app would interact. With the feedback and requests from the clients, we managed to have a final version which they are satisfied with, so when we start to develop the actual app, we can have a good model to base on.
Tech Stack
With the preliminary research and designs finalised. We discussed the tools and architecture that we should develop with. This is key as we need to ensure the quality of the application and also the scalability for future development. Having the tools and structures planned out can save us a great amount of time for our development.
We have concluded to use the following tech stack:
- Front end: React
- Back end: NodeJS
- Database: PostgreSQL
Front End Development
Front End Components breakdown:
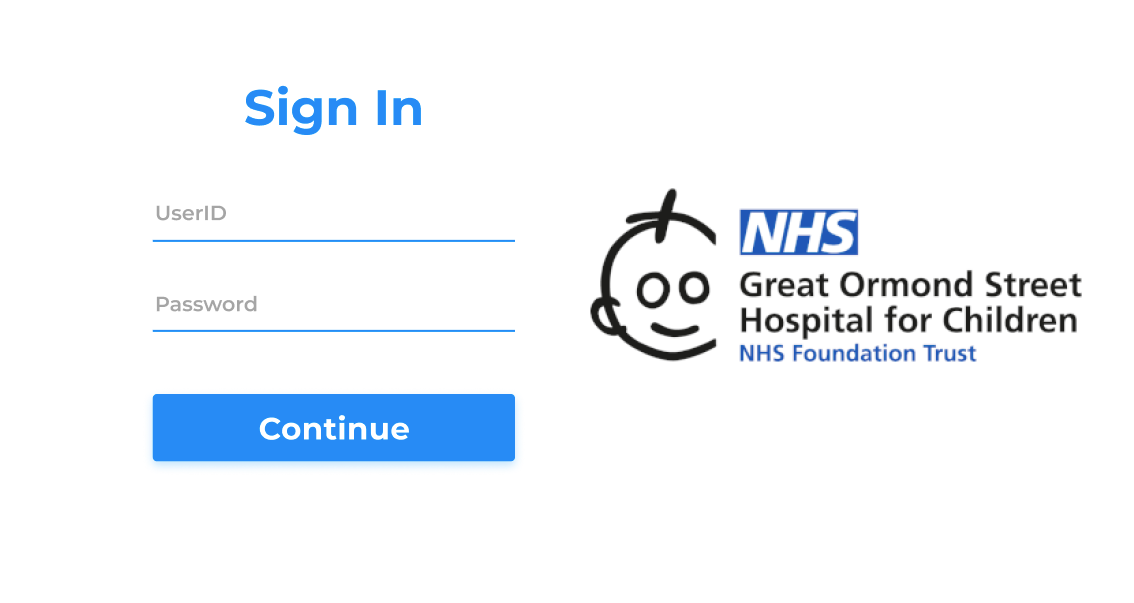
- Sign In Page
- Input (UserId and Password)
- Continue Button
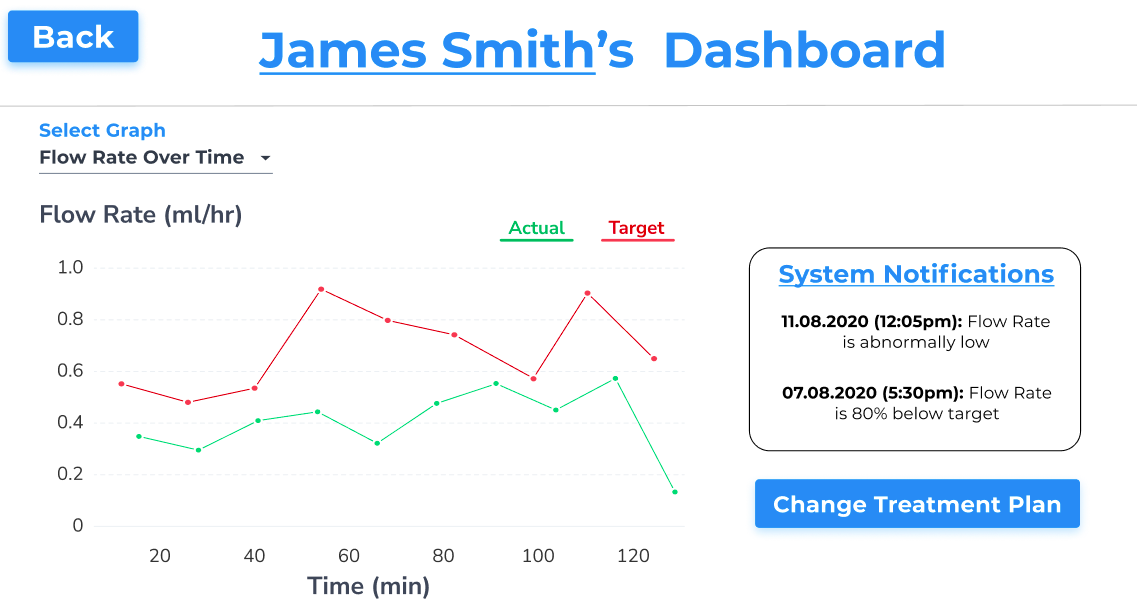
- Patient Dashboard
- Graph (use Chart.js)
- Filters
- Toggle
- Graph Selector
- Title
- “Notifications” Button
- “Change Treatment Plan” Button
- Graph (use Chart.js)
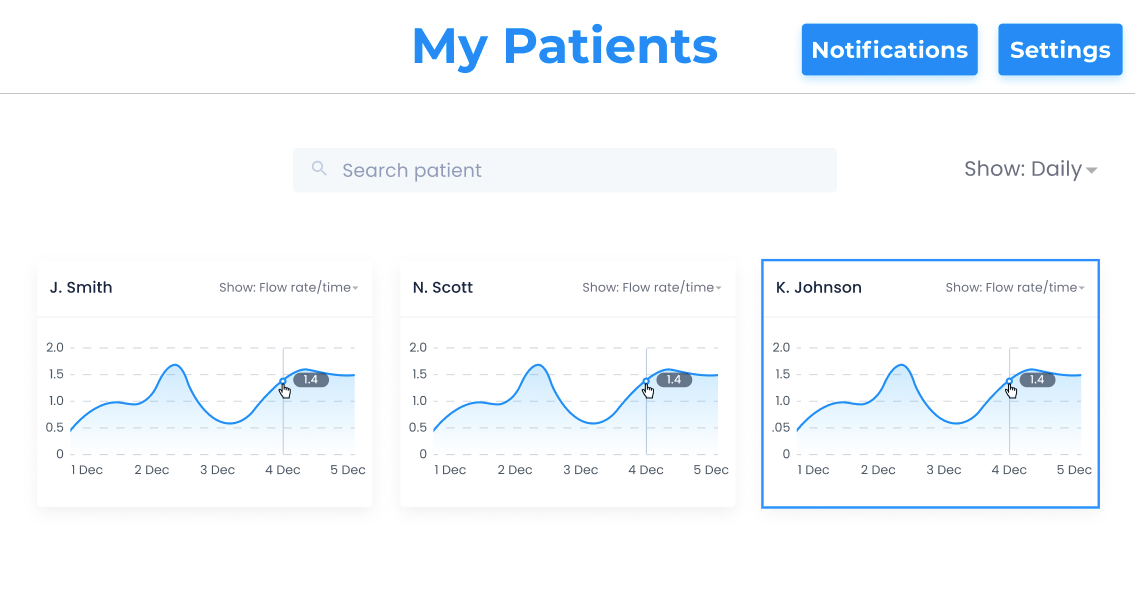
- My Patients
- Search Bar
- Graph Preview (with Patient name)
- Filter Patients
Back End Development
Back End Components breakdown:
- API endpoints:
- /auth/login
- POST – route to the login of the user. Assigns a token to the user when logged in successfully
- /auth/register
- POST – route to creating a new user account
- /dashboard
- POST – route to display the feed data of the patient or the list of patients of the clinician
- /getFeeds
- POST – route to fetch the feed data from the database
- /patientInfo/id
- POST – route to fetch the patient information according to the if specified
- /myPatients/add
- POST – route to adding or removing the access of a patient of the clinician
- /patientInfo/changeTreatmentPlan
- POST – route to change the treatment plan data of the patient
- /auth/login
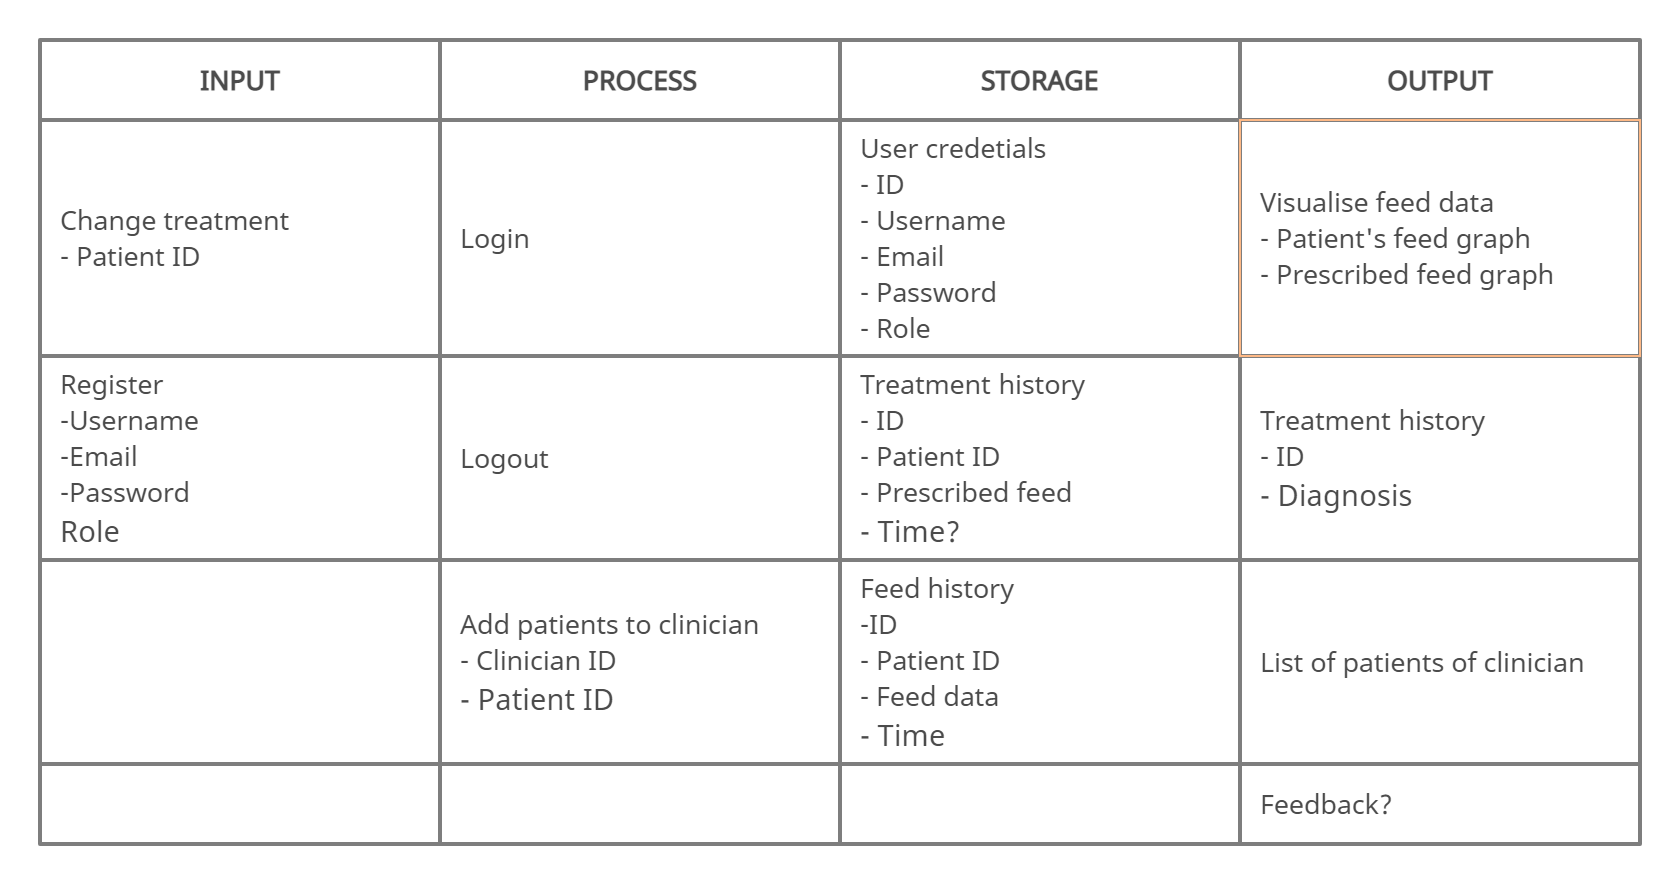
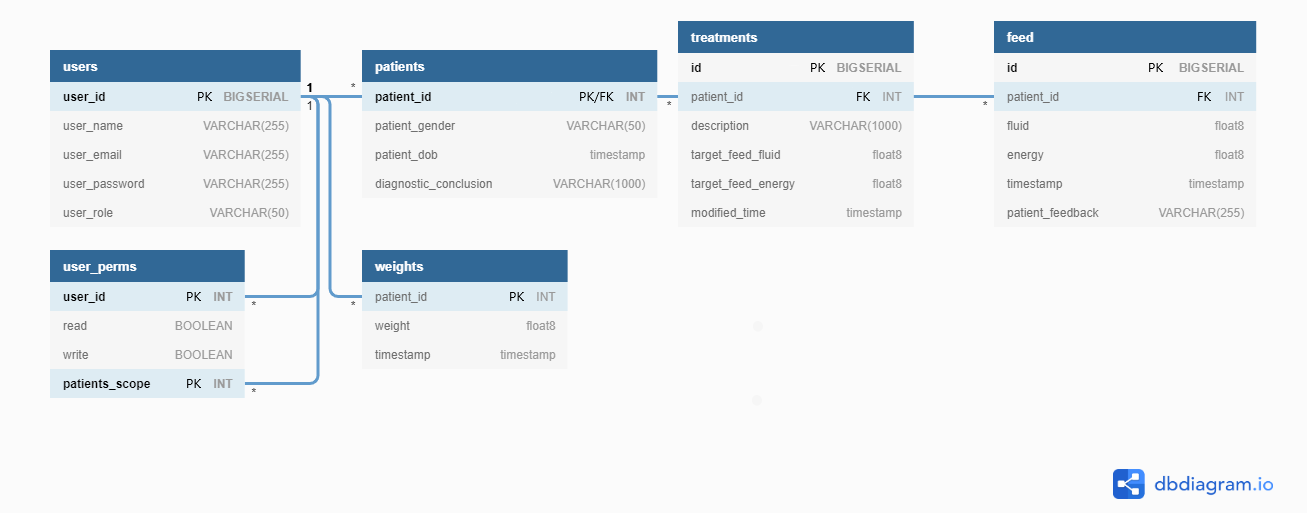
Database Design
IPSO (Input, Process, Storage, Output) table
ER Diagram.
Next Steps
We have mostly spent our time of the first term researching and planning out the structure of our application since there is a lot of information to look at for this project. However, we do have these things sorted right now and we will progress to the next term focusing on the programming aspect to develop the actual app.