Week 11 - Development - Dashboard Page Implemented and Login, Register Page Update
Overview
This week, we spent time on the dashboard page which is one of the major functionalities of our app. We have also taken in some ideas of our client towards our app so far.
Dashboard Page
We had most of our focus on creating a dashboard page. To achieve this, we first made a Linechart component that imports from react-chartjs-2. This component is a wrapper for Chart.js and we find it very helpful with its easy to use and huge customizability. The graph will be taking in all the feed data and will continue to monitor if there are new feed data. It will be displaying a curved line and the axis will be annotated with intervals and dates. We think a curve line is great here since it is better to visualise the change in this way rather than many spikes with straight lines
We started off by just having feed as y-axes and time as x-axes in order to show the functionality. More different data will be added to the graph in the future.
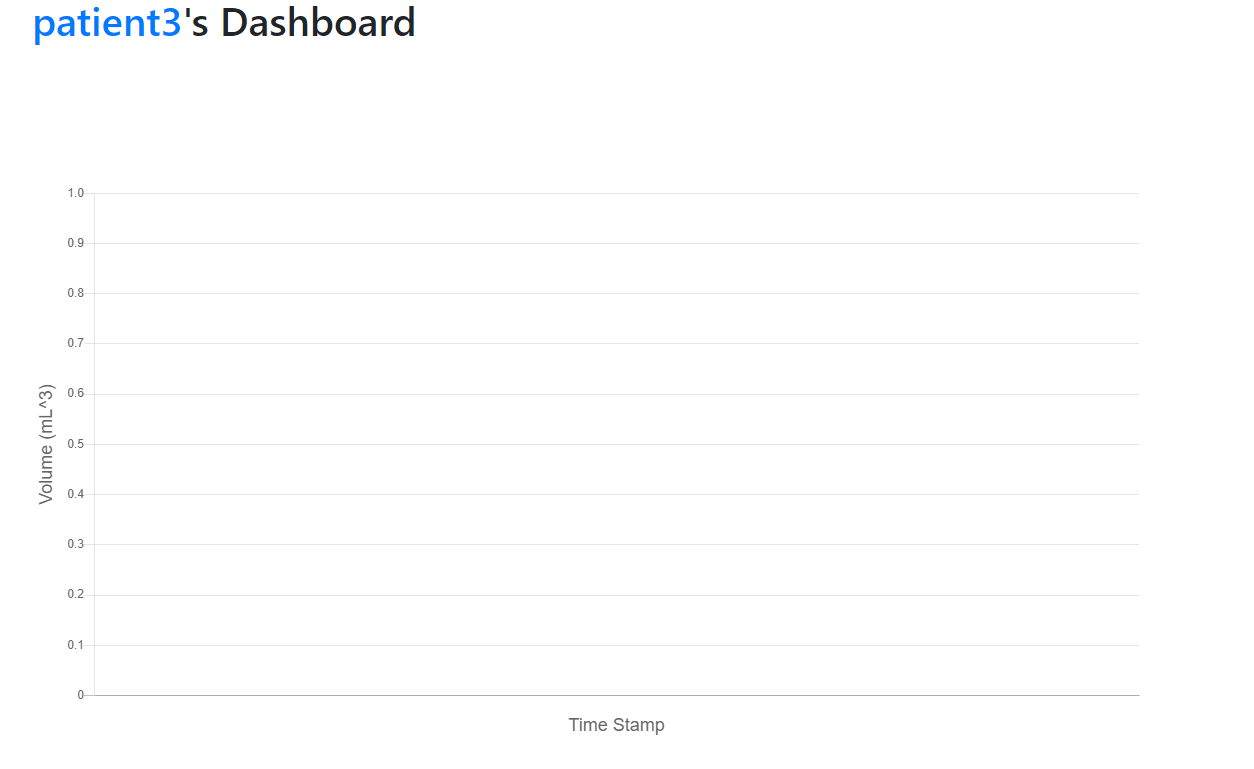
This graph will then be displayed in the patientDashboard, which is another page we have created. This will be what the patient see straight after they login. Since they are not supposed to have any change to the data, they will only be able to see the graph for now. We might think about what actions they can perform here in the future.
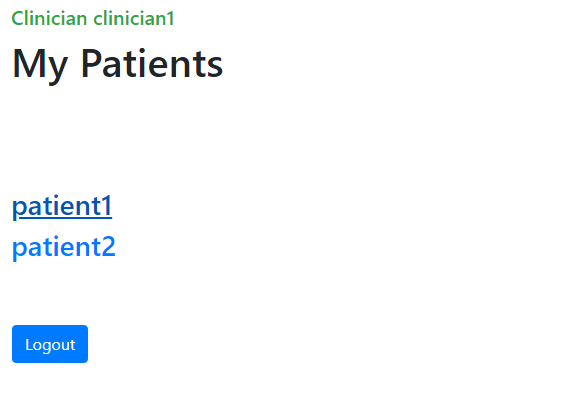
As for the clinicians, they will have a clinicianDashboard page. This enables them to view the list of all the patients so that they can choose which patient they want to view. The clinician will be clicking on the name of the patient they desire, the patientDashboard page of the correspondent will be opened up.
Apart from the LineChart and what will be displayed to the patient, we plan to add functionalities specifically for clinicians, for example, changing the prescribed feeds for the patients.
Login and Register Page Update
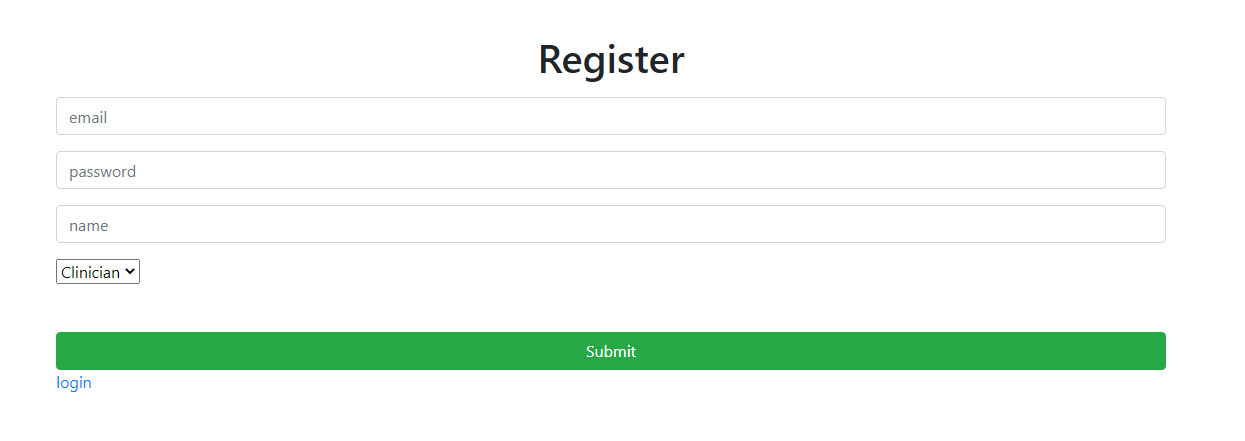
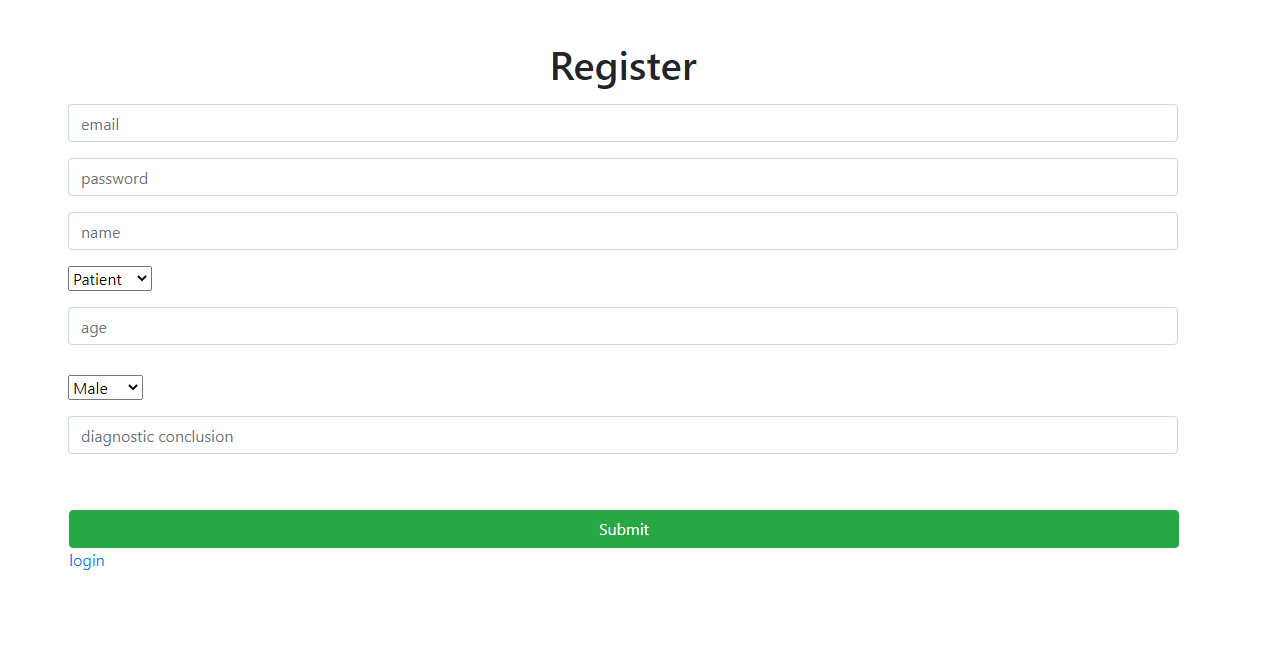
We also made some changes to the pages we made last week after the feedback from our clients. We have added the option to choose to register as a clinician or a patient so that users will have different accessibility and functionality in the app.
To do this, we also needed to alter the structure of the user table in our database to store the role of the user, so now it is possible to distinguish between them.
Next Steps
We have planned the following week to continue to work on the dashboard, making it able to display the graph by providing it with the simulated feed data, so that it can have a visualisation to the data and also for us to add more functionality to it.