Week 13 - Development - Dashboard Visualisation and More Functionalities
Overview
We have spent time this week adding the prescribed feed graph onto the dashboard, as well as a different graph. We can also now filter the dates to view data in a specific range.
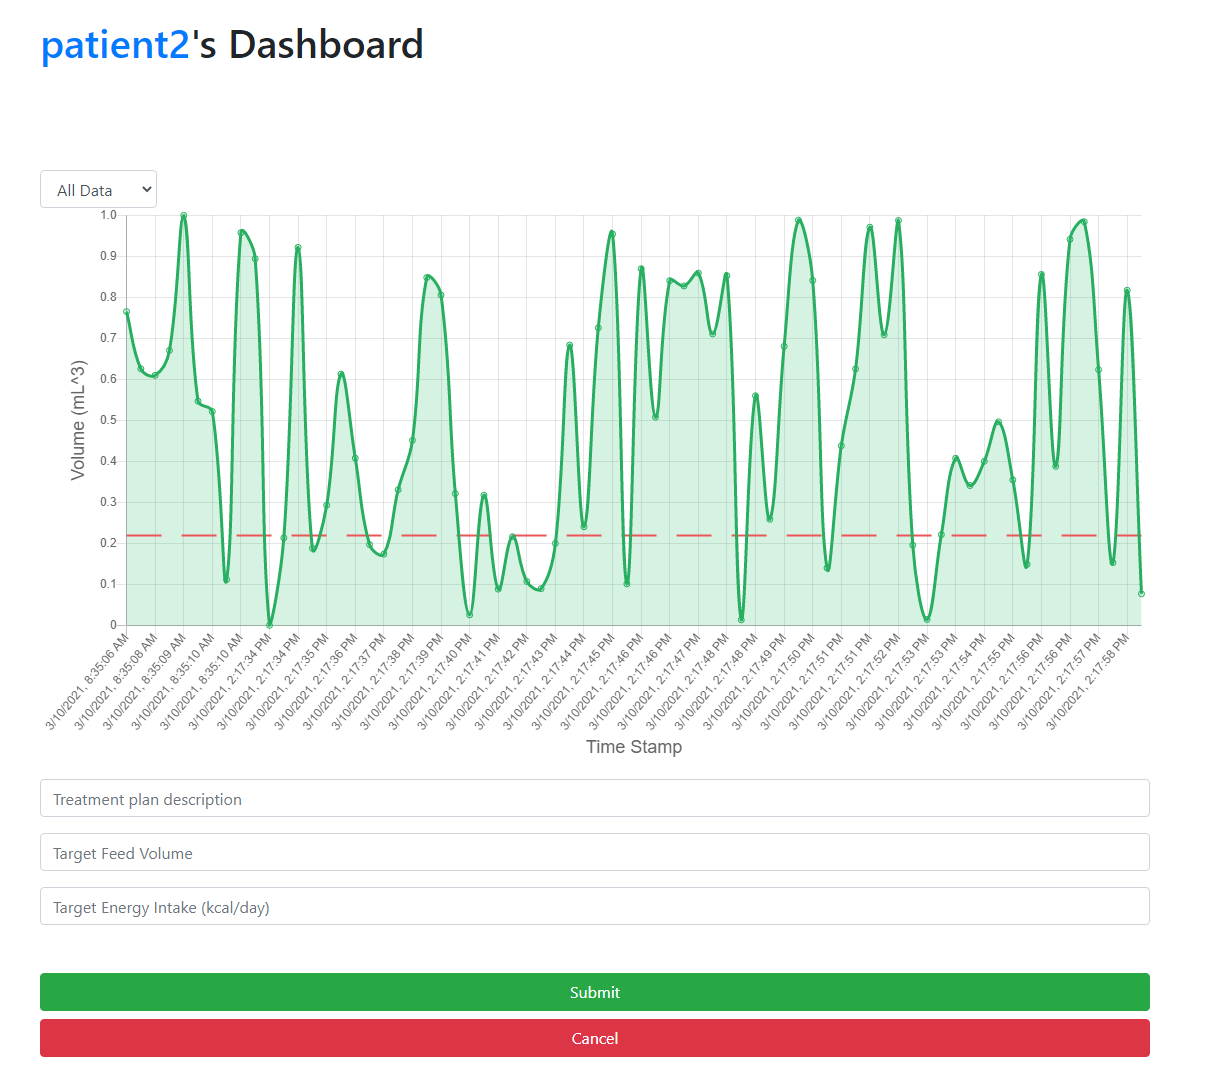
Change Treatment
We also added the ability to change the prescribed feed of the patients. This is important as it allows both patients and clinicians to observe their feed progress by comparing them. Having the ability to change the value of it let the clinician change the value for the patients accordingly. On the patient dashboard, we check isClinician, then they will be able to click on change the treatment on the patient if the user is a clinician. When the data of the new data is entered using onSubmitForm, these data will be passed to /patientInfo/changeTreatmentPlan. The new treatment plan data will be updated to the database with allTreatmentPlans.push.
Dashboard - visualisation
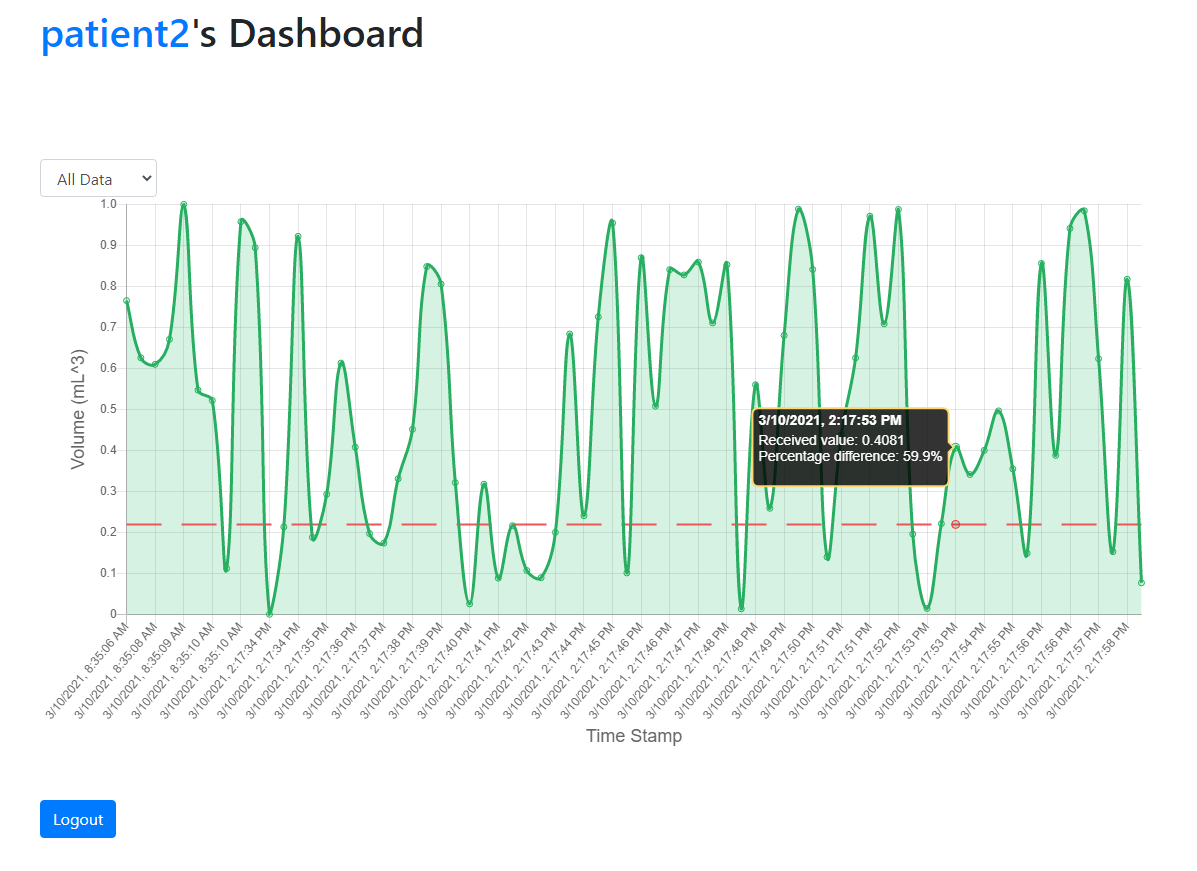
If there exists a treatment target, the LineChart will now display it by overlaying it onto the original feed graph, so there will be two graphs on the dashboard. This allows the user to easily compare the actual feed and the prescribed feed. Users can also look into the details of it by hovering on the individual points on the graph to show the exact values of both and even the percentage difference. This is a great way for the users to review and feedback on.
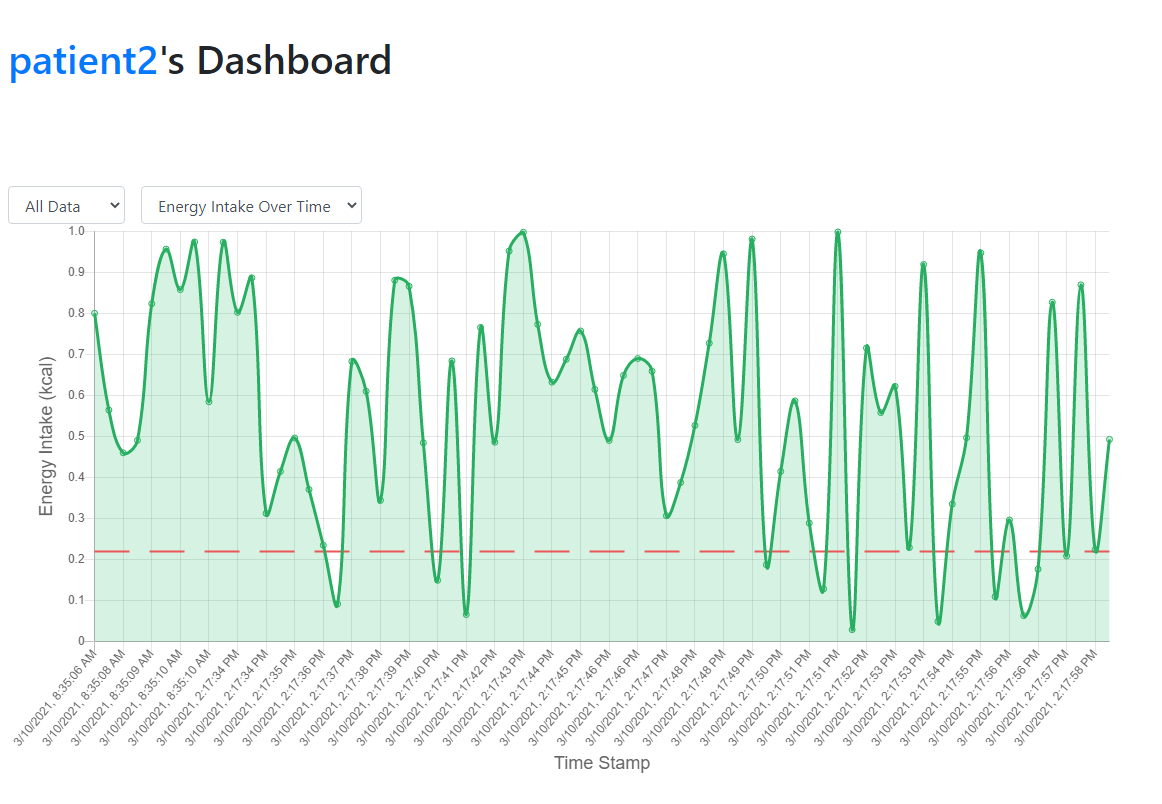
Dashboard - new graph
We have also added a new graph of Energy Intake Over Time which is a variant of the Volume Over Time we had before. This gives the user to view other data and also the option to change to another graph they desire.
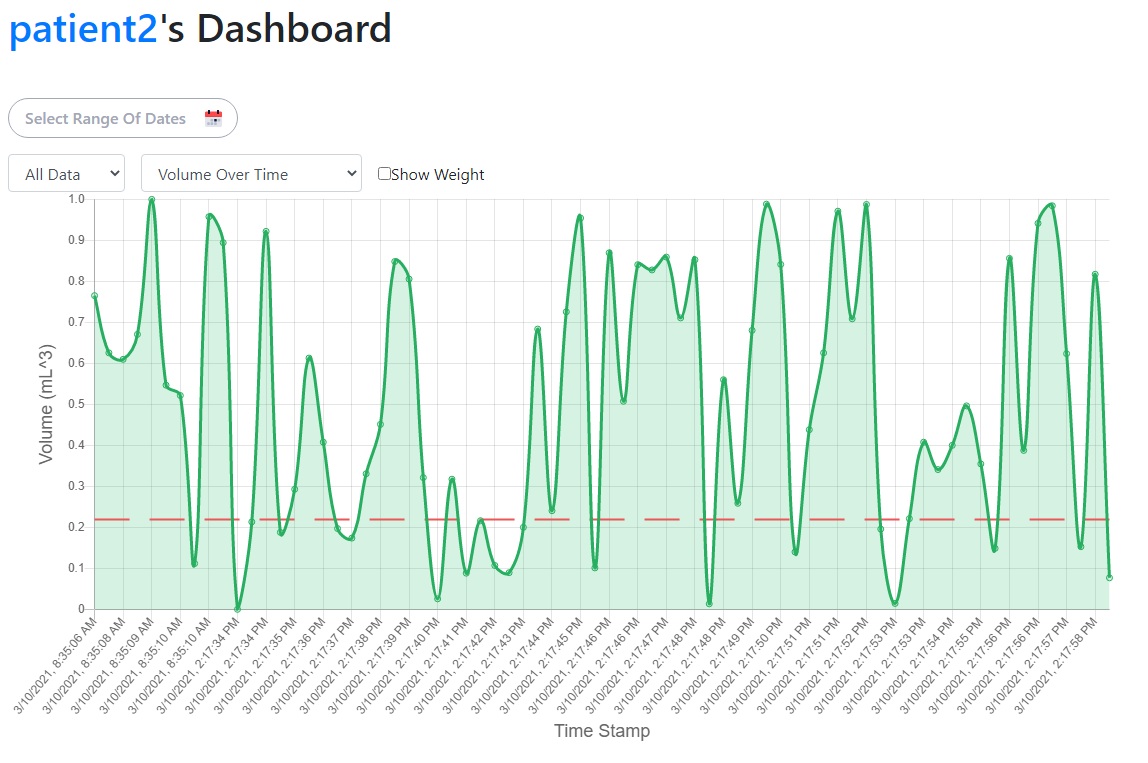
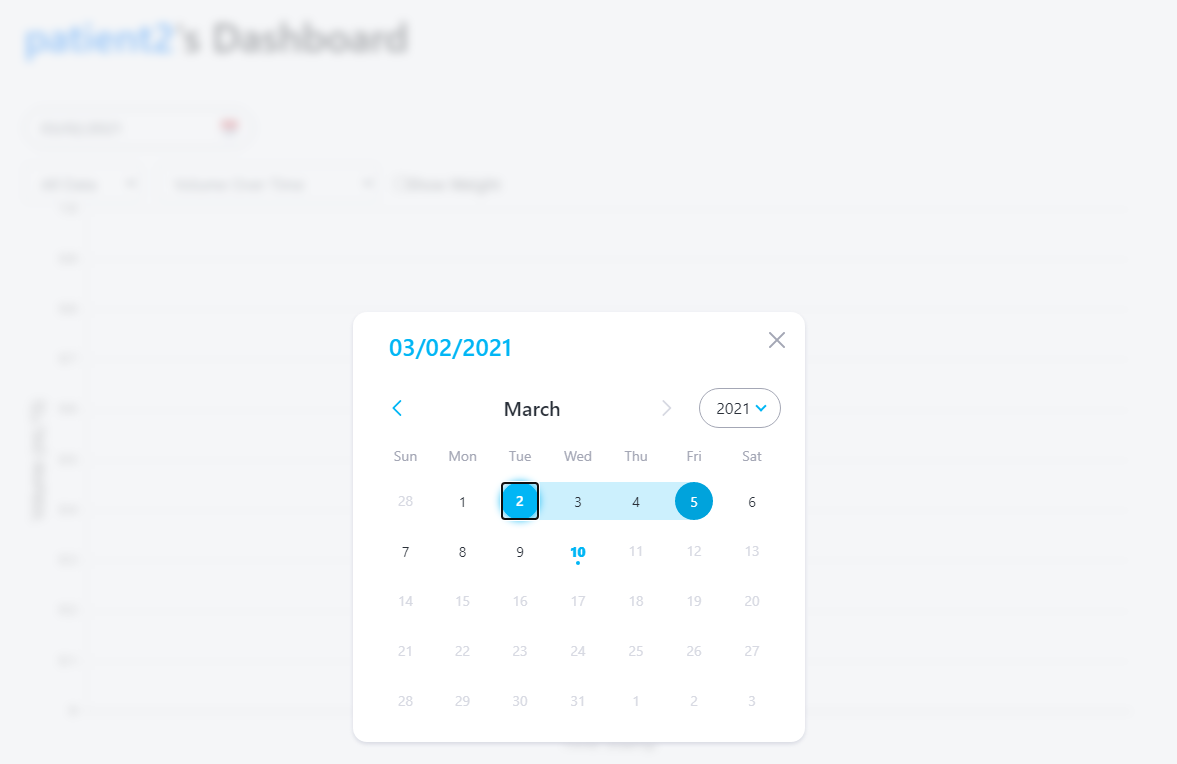
Filter date
This is another feature that allows users to view specific data on specific dates. We achieved this with the user of RainbowDatepicker from react-rainbow-components. It allows user to have a popup of a calendar to pick two dates which are the start and end date of the desired range. We then get that date and format it using fornmatDates to get the range of the date. Only the data within the range will then be determined and displayed on the graph.
Next Steps
We planned to develop more on the treatment graph, giving it the ability to also show past treatments. We also want to let the clinician be able to add patients, so they will be showing only the patients they are allocated.